Introduction
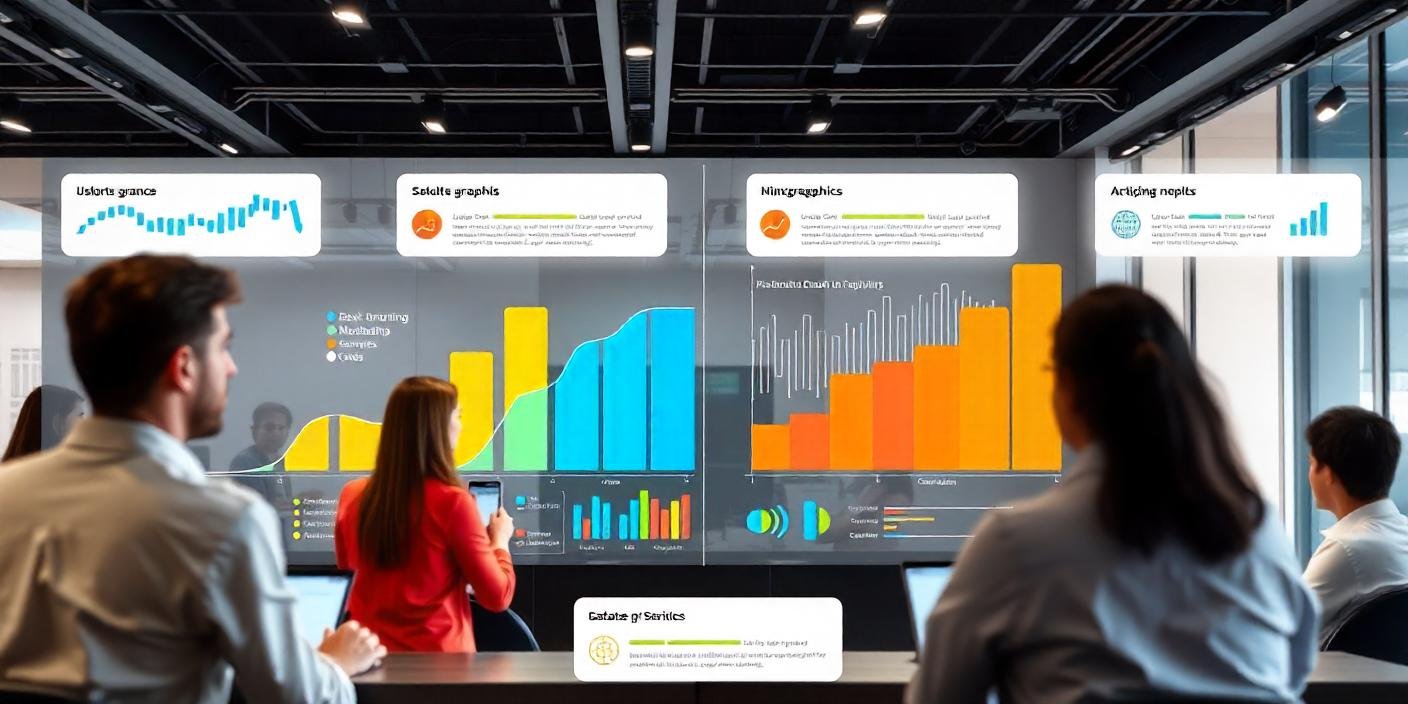
In today’s data-driven world, the role of visual Data communication in consulting has never been more critical. With the ever-increasing volume and complexity of data, consultants are turning to advanced visual data representation techniques to enhance their services, provide clearer insights, and drive better decision-making. Visual communication not only simplifies complex information but also aids in telling compelling stories that resonate with clients. This blog explores the emerging trends in consulting, focusing on how visual data representation is transforming the industry and improving consulting practices.
1. The Shift Towards Data Visualization
Data visualization has evolved from a mere reporting tool to a strategic asset in consulting. Modern consultants use sophisticated visualization techniques to turn raw data into meaningful insights. Interactive dashboards, infographics, and dynamic charts are now commonplace in consulting presentations, allowing clients to grasp complex data quickly and intuitively.

Tableau and Power BI are leading tools in this space, providing robust platforms for creating interactive dashboards and detailed visual reports. These tools enable consultants to design custom visualizations that reflect clients’ specific needs and preferences, ensuring that data insights are both accessible and actionable Tableau for Consulting.
2. Interactive Dashboards for Real-Time Insights
Interactive dashboards are revolutionizing consulting services by providing real-time visual data insights and facilitating dynamic decision-making. These dashboards allow consultants to present data in a format that clients can interact with, explore, and customize.
Power BI offers a range of interactive features, including drill-down capabilities, filters, and real-time data updates, which enhance the client’s ability to engage with the data Power BI Features. This interactivity ensures that clients can explore various data scenarios and make informed decisions based on up-to-date information.
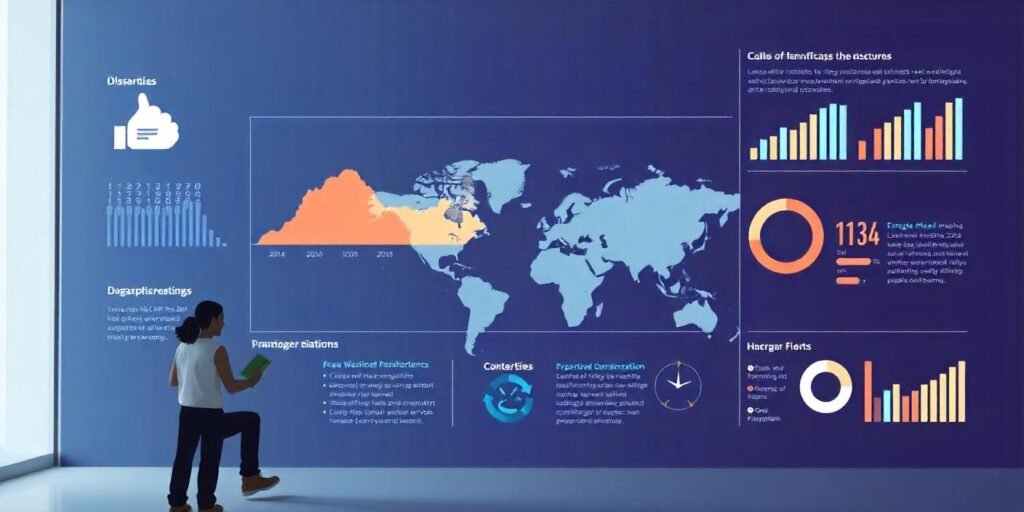
Additionally, interactive dashboards support scenario analysis and forecasting by visualizing different visual data scenarios and their potential impacts. This capability is particularly valuable for strategic planning and risk management, helping clients navigate uncertainties and make data-driven decisions.
3. Infographics for Simplified Communication
Infographics are an effective tool for simplifying complex data and presenting it in an easily digestible format. Consultants use infographics to summarize key findings, highlight trends, and illustrate data-driven insights in a visually appealing manner.
Canva and Venngage are popular platforms for creating infographics that combine text, images, and data to convey important information Canva Infographics. These tools help consultants create engaging visuals that capture attention and facilitate understanding, making it easier for clients to grasp complex concepts and data.
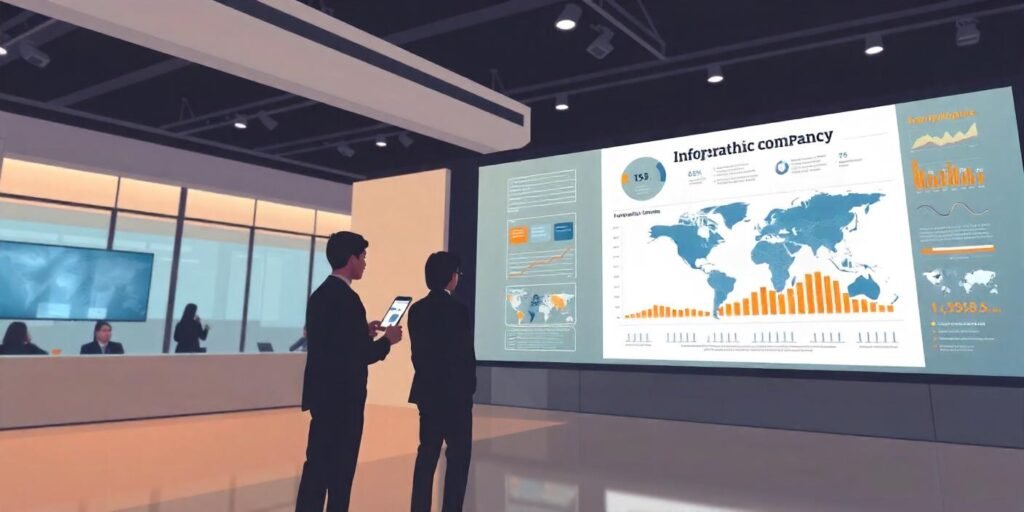
Infographics are also useful for creating client reports and presentations that effectively communicate key messages and support strategic recommendations. By visualizing data trends and insights, consultants can enhance their storytelling and make their recommendations more compelling.
4. Geographic Information Systems (GIS) for Spatial Data Analysis
Geographic Information Systems (GIS) are increasingly being used in consulting to analyze spatial data and visualize geographic patterns. GIS technology enables consultants to map and analyze data with a geographic component, providing valuable insights into location-based trends and relationships.
ArcGIS and QGIS are leading GIS platforms that offer advanced mapping and spatial analysis capabilities ArcGIS for Consulting. These tools help consultants visualize geographic data, identify regional trends, and make data-driven decisions based on spatial information.
GIS is particularly useful in industries such as urban planning, real estate, and logistics, where location-based insights are critical for decision-making. By integrating GIS into their consulting practices, consultants can offer clients a deeper understanding of spatial dynamics and support strategic planning with geographic data.
5. Storytelling with Data: The Art of Data Narratives
Data storytelling is an emerging trend in consulting that combines visual data visualization with narrative techniques to create compelling and informative presentations. By weaving data into a coherent story, consultants can engage clients and make complex information more relatable and memorable.
Microsoft PowerPoint and Prezi are popular tools for creating data-driven presentations that incorporate storytelling elements Prezi Data Stories. These tools allow consultants to craft visually engaging presentations that highlight key insights and guide clients through a logical progression of information.

Effective data storytelling involves selecting the right visual elements, structuring the presentation to build a narrative, and using data to support the story. By mastering the art of data storytelling, consultants can enhance their ability to communicate findings and persuade clients with data-driven arguments.
6. The Role of AI and Machine Learning in Data Visualization
Artificial Intelligence (AI) and Machine Learning (ML) are playing an increasingly important role in data visualization and consulting. These technologies enable advanced data analysis, pattern recognition, and automated visualizations, providing deeper insights and enhancing decision-making.
Qlik and SAS offer AI-powered analytics and visualization tools that leverage machine learning algorithms to analyze data and generate insights Qlik AI Analytics. These tools can automatically identify trends, detect anomalies, and suggest visualizations based on the data, streamlining the analysis process and improving accuracy.
AI and ML also support predictive analytics by analyzing historical data to forecast future trends and outcomes. This capability is valuable for strategic planning, risk management, and scenario analysis, helping consultants provide clients with actionable insights and data-driven recommendations.
7. Enhanced Data Security and Privacy in Visualization
As data privacy and security concerns continue to grow, consultants must prioritize safeguarding sensitive information in their visualizations. Data visualization tools are incorporating advanced security features to ensure that client data is protected and compliant with regulations.
Domo and Looker offer secure data visualization platforms with robust access controls, encryption, and compliance features Domo Security Features. These tools enable consultants to create and share visualizations while maintaining the confidentiality and integrity of client data.
Ensuring data security in visualizations is crucial for maintaining client trust and complying with data protection regulations. By implementing best practices for data security, consultants can safeguard sensitive information and provide clients with peace of mind.
8. Customization and Personalization of Visual Data
Customization and personalization are key trends in data visualization, allowing consultants to tailor visualizations to meet clients’ specific needs and preferences. Customizing visualizations ensures that the data is relevant, meaningful, and aligned with the client’s goals.

Tableau and Power BI offer extensive customization options, enabling consultants to design visualizations that reflect clients’ branding, terminology, and preferences Power BI Customization. This level of personalization enhances the relevance and impact of the visualizations, making it easier for clients to understand and act on the data.
Personalized visualizations also support client engagement by presenting data in a format that resonates with their specific context and objectives. By customizing visualizations, consultants can enhance their ability to communicate insights and drive client success.
9. Collaborative Visualization Tools for Team Work
Collaborative visualization tools are becoming increasingly important in consulting, enabling teams to work together on data analysis and visualization projects. These tools facilitate real-time collaboration, feedback, and sharing of visualizations, enhancing teamwork and decision-making.
Google Data Studio and Microsoft Power BI provide collaborative features that allow multiple users to access, edit, and comment on visualizations simultaneously Google Data Studio Collaboration. These tools support collaborative analysis, enabling teams to leverage diverse perspectives and expertise in their data-driven projects.
Collaborative visualization tools also enhance transparency and communication by allowing team members to track changes, review feedback, and contribute to the analysis process. This collaborative approach improves the quality of insights and supports more effective decision-making.
10. Future Trends in Visual Data Representation
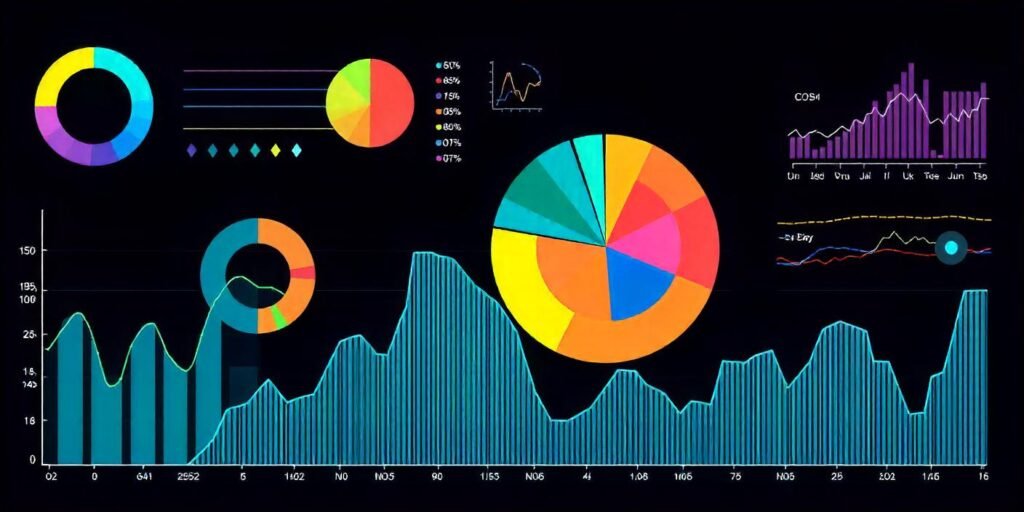
As technology continues to advance, new trends in visual data representation are likely to emerge. Emerging technologies such as augmented reality (AR), virtual reality (VR), and advanced data analytics will further enhance the capabilities of data visualization and consulting.
AR and VR offer immersive visualization experiences that can transform how data is presented and interacted with, providing new ways to explore and analyze information AR and VR in Consulting. These technologies have the potential to revolutionize data visualization by offering interactive and engaging experiences.
As data continues to grow in complexity and volume, the role of visual communication in consulting will become even more critical. Staying ahead of these trends and adopting innovative visualization techniques will be essential for consultants to provide valuable insights and drive client success.
Conclusion
In 2024, visual data representation is playing a crucial role in enhancing consulting services by providing clearer, more actionable insights. From interactive dashboards and infographics to AI-driven analytics and collaborative tools, visual communication is transforming how consultants analyze, present, and interpret data. By leveraging advanced visualization techniques, consultants can improve their ability to communicate complex information, support decision-making, and drive client success. As the industry continues to evolve, staying abreast of visual communication trends will be key to delivering exceptional consulting services and achieving strategic objectives.
Explore our AI in Animation articles
How AI is Revolutionizing the Animation and Design
Top 10 Visual Communication Trends to Watch in 2024 (studioimageworks.com)
Runway AI: Revolutionizing the Video Production Animation articles


